BuzD Presence Analytics
...because the world is abuzz with information.
Ready to get started with Presence Analytics? Contact us for a live demo!
Not only will the BuzD Dashboard deliver exciting information about your customer traffic, we provide you with the unique ability to import your marketing events calendar and sales figures resulting in a comprehensive view of your marketing efforts. |
BuzD delivers a whole new level of documentation. Not only do we show you "how" to use our dashboard, our marketing guru's provide you with step by step tutorials on how to make the most out of the collected data. In addition to well written documentation, we provide you with easy to understand video tutorials ensuring that you get the most out of your investment in BuzD. |
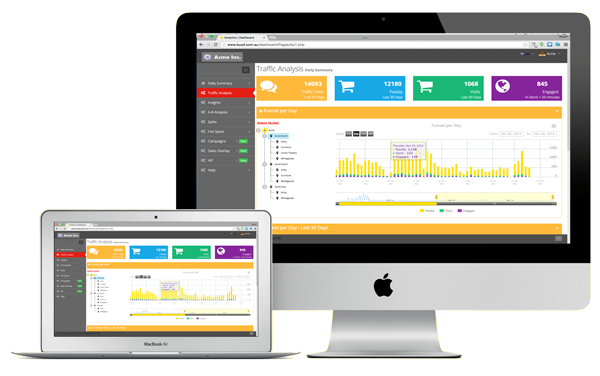
In 2014 sales of tablet sales outnumbered the humble desktop computer. Ensuring that you can check how your current campaign is running no matter where you are, BuzD Dashboard has been designed to provide easy to read and use features on desktops, tablets and smart-phones. |
 À la carte
 Well Documented
 Responsive Design
Overview:
It's like Google Analytics for Physical Locations
What does it do?
BuzD provides 'real time' analytics that help you observe the foot traffic of your customers inside and around your physical location. We deliver information about your customers that has never been accessible to you beforehand help your company improve sales, customer engagement, store layout and staffing placement
Powerful & Clean
Responsive & Bright Theme
The BuzD dashboard has been designed to provide easy viewing. Each screen is precise, clean and provides only the information you need.
Genuine Value Reports
Not just pretty charts and graphs
With BuzD you can import your marketing events and combine traffic analytics providing real-time results. In addition to adding your marketing events BuzD allows you to import your sales figures. The integrated Traffic, Marketing and Sales data provides you with instant feedback at a glance.
Getting BuzD
Today, more than ever before you need to understand your customers shopping habits. In order to achieve better bottom line and customer loyalty you need to know more about how often customers come into your location, what they do when they are there, and how long they stay for. This is exactly how online retailers increase their customer return rates and basket size.
Do you know how many people walk past your location every day?
Do you know how many of them come in? How long do they stay?
Have they been in your outlet before or is this the first time?
What times of the day does most of the traffic pass and enter your outlet?
Analytics:
Explore The Potential
Understanding flow rates is essential
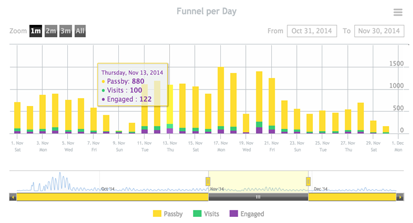
BuzD Traffic Analysis delivers real facts about the people in and around your location.
- How many people pass your location each day?
- How many come into your store?
- How well do you engage with those that visit?
BuzD Traffic Analysis provides you with the facts that answer these questions.
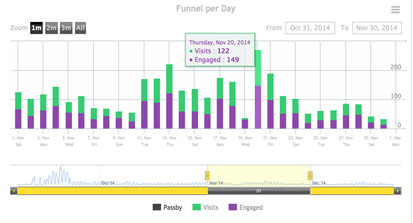
Store Visits
How long do customers stay?
Measuring passing traffic is a great start but you need to dig deeper in order to gain value
- Do visitors come into your location then leave quickly?
Being able to measure how long visitors stay provides a valuable insight into your customers behaviour. Customers that stay longer will generally consume more of your product or services. Understanding how long people stay can be a measure of your store layout and employee effectiveness.
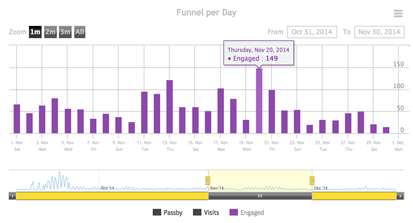
Engaged Customers
Customer engagement increases sales
Analysing the relationship between how long a customer stays and how much they spend offers key insights into how well your staff are engaging your customers. Tracking sales against engagement levels often provides an insight into the effectiveness of your staff.
Effective customer engagement not only leads to increased sales, it will help build customer satisfaction and in turn return rates customer loyalty.
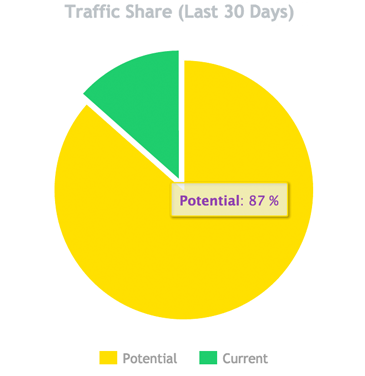
Traffic Share
What is your potential?
Is your store located in the right area or is your marketing effective? Without BuzD Presence Analytics all you can do is guess what your share of passing traffic might be. By measuring your ratio of passing traffic against customer visits you are able to quickly assess whether a new window display is working or whether the latest campaign is brining people into your store. Why would you wait until the end of the month to judge only by sales results. Your marketing may be bringing people into your location, but are they staying?...
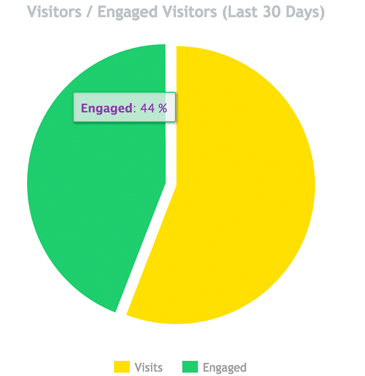
Customer Engagement
How effectively are you engaging your visitors?
How long a visitor stays in your location says a lot and can be a direct influence on spend levels. Understanding whether customers just pop in then out again (bounce rate), come in and stay for a short time, or spend quality time engaged with your staff may be a big factor influencing your bottom line.
With insights like those provided by BuzD you can now measure customer engagement in depth.
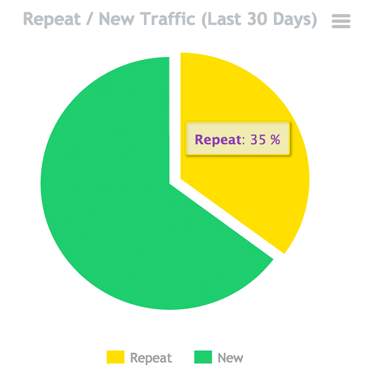
Customer Loyalty
How many of your customers return?
Measuring passing traffic is a great start but we need to dig deeper in order to gain value. Do you know what percentage of visitors are net new or have visited before?
- Do your customers return, and if so how often do they visit?
- Are you attracting new visitors to help grow your business?
Understanding these ratios provides an excellent basis on which you can build your marketing events, campaigns, and customer loyalty programs.
Weekly Splits
Is my marketing effectiveIs your store located in the right area or is your marketing effective? Without BuzD Presence Analytics all you can do is guess what your share of passing traffic might be. By measuring your ratio of passing traffic against customer visits you are able to quickly assess whether a new window display is working or whether the latest campaign is brining people into your store. Why would you wait until the end of the month to judge only by sales results. Your marketing may be bringing people into your location, but are they staying?...
Features:
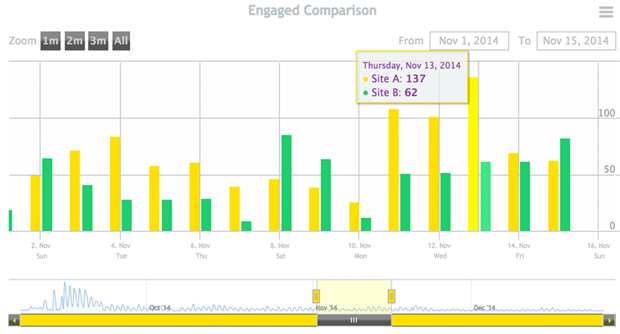
Variation Analysis
Why does one area outperform another?A-B Testing provides the means by which you can measure locations not simply by sales data alone. By utilising A-B tests we can now compare performance based on facts about traffic levels, visit duration, engagement levels and much more. Whether you want to compare the differences between locations or the differences between departments, BuzD provides the tools to make this possible. Is performance linked to location, employee behaviour, store layout etc.. These and many other answers will start to show themselves through detailed analysis.
Traffic Flow
Is your store layout optimal?
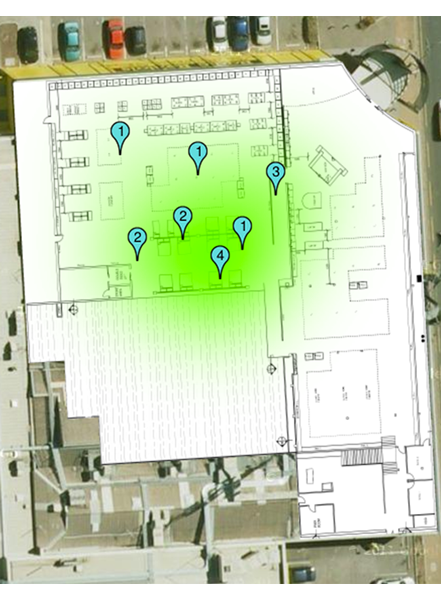
How do you measure the one area against another in your location? Do you simply rely on the quantity of products sold from that area, or do you measure how long people stay in the area. By utilising BuzD Hot Spot analysis you can see where traffic congestion areas are, find out how long people have to wait in queues and much more.
By understanding how people move around within your location the guess work is taken out of where to place premium merchandise and how to direct traffic along the path you most desire. This results in bigger basket share.
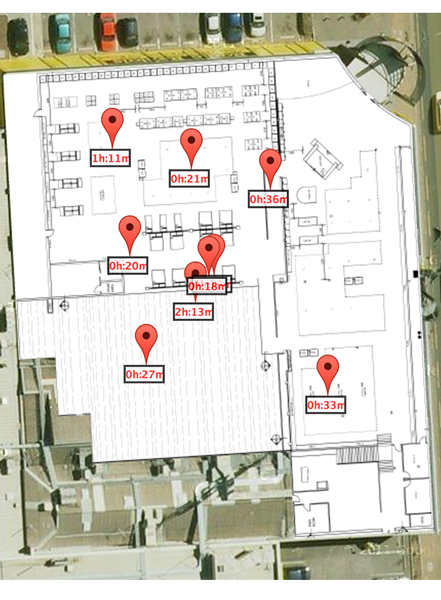
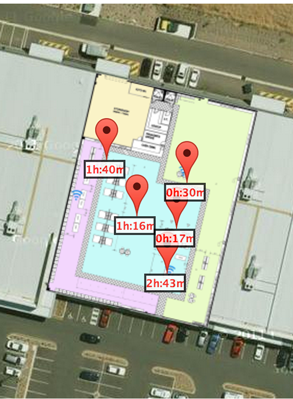
Dwell Times
Where do most people spend time?
Do your customers spend more time in one or two areas within your location? Why is this? Is the area confusing or is it really engaging? Understanding how long the average person spends within a given area provides you with the knowledge on where to either simplify the layout, or even better, place high value products next to fast moving ones in order to increase revenues and the bottom line.
Layout and Traffic Flow
Direct your customer movements
Measuring passing traffic is a great start but we need to dig deeper in order to gain value. Do you know what percentage of visitors are net new or have visited before? - Do your customers return, and if so how often do they visit? - Are you attracting new visitors to help grow your business? Understanding these ratios provides an excellent basis on which you can build your marketing events, campaigns, and customer loyalty programs.
Advanced:
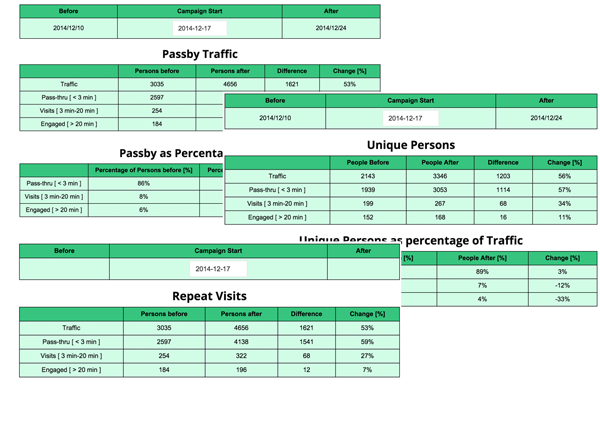
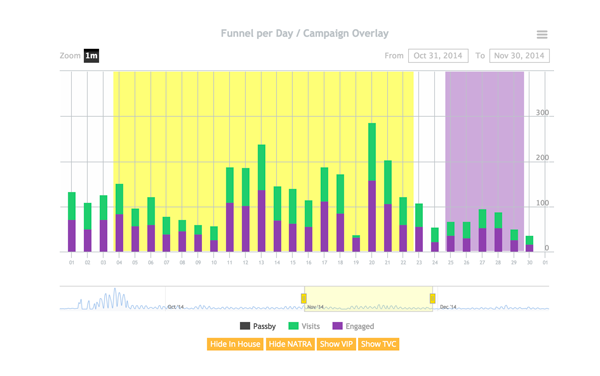
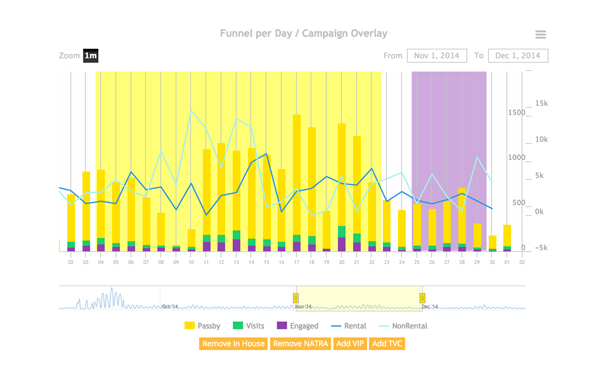
Marketing Campaigns and Event Overlays
One convenient location for comparison
When you use BuzD Presence Analytics there is no need to download traffic data and marketing calendars then spend hours setting up complex spreadsheets in order to demonstrate the effectiveness of a marketing campaign or event. The BuzD dashboard allows you to build your marketing and event schedule and display traffic figures directly mapped onto your events. Forget about long hours playing around with lookup tables and Photoshop overlays... we do all the hard work for you.
Comprehensive Reporting
Traffic, Marketing and Sales
When you use BuzD Presence Analytics there is no need to download traffic data and marketing calendars then spend hours setting up complex spreadsheets in order to demonstrate the effectiveness of a marketing campaign or event. The BuzD dashboard allows you to build your marketing and event schedule and display traffic figures directly mapped onto your events. Forget about long hours playing around with lookup tables and Photoshop overlays... we do all the hard work for you.
VIP Alerts
"Welcome back Mrs Smith"
The BuzD VIP Alert system monitors for known customer presence. Whenever a customer is observed within your location a welcome is sent to the customer and an "Alert" that the customer has returned is sent to the location manager and/or all local staff. There are many uses for the VIP Alert system, including unwanted visitor alerts at sports stadiums etc.. In the case of a VIP welcome message, this brings that feeling of the old corner store back when the store manager knew all of their customers. Making the customer feel welcome goes a long way to building loyalty.
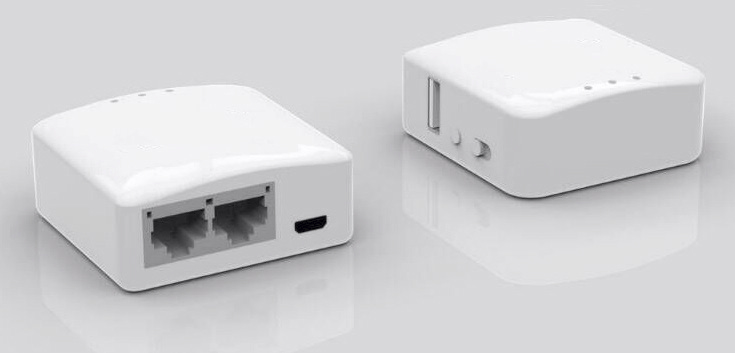
MiniSensor:
Low profile Sensor with integrated antennas
The BuzD MiniSensor is IEEE802.11n/g/b standards-based, and operate on both 2.4 GHz b/g/n and 5 GHz a/n spectrums. Supporting the latest 802.11 technology.
The BuzD MiniSensor is a next generation mini form factor analytics sensor, perfect for discrete installations, such as on stock shelves. Supporting MIMO technology with spatial streams, this analytics sensor provides association rates of up to 150 Mbps.
The BuzD MiniSensor has been designed specifically with real-time analytics in mind. The firmware and antenna design have been optimized to provide the most highly accurate dedicated analytics sensor on the market. Designed and built by BuzD, the MiniSensor may be deployed in sensor only mode, and through a small software upgrade may be upgraded at a later date to perform as both a sensor and highly secure Wi-Fi Access Point.
Deploying the BuzD MiniSensor in sensor only mode reduces the cost of implementation and where customers have already deployed a Wi-Fi solution keeps the cost to a minimum while ensuring the best analytics sensor designed specifically for Presence Analytics.
- Delivers up to 150Mbps wireless data rate.
- Supports multiple working mode: AP, Router, Client.
- Supports 64/128-bit WEP, WPA & WPA2 security modes.
- Provides one Ethernet Port plus one PoE Ethernet Port.
- Supports Power over USB and Power over Ethernet.
- Includes a USB cable and power supply
| Specifications | |
|---|---|
| CPU | Atheros AR9330 - MIPS 24Kc V7.4 400Mhz |
| Ram | DDR 64MB |
| Rom | 16M |
| Interface | 2 100mbit/s RJ-45 (LAN/WAN) 1 x USB (power) |
| LED | Red and green |
| Wireless | IEEE802.11n/g/b |
| Button | Press to toggle wireless radio |
| Antenna | Inverted F PCB trace antenna or external omni antenna |
| Power Supply | 5V/1A micro USB |
| Dimensions | 58mm*58mm*22mm |
| Weight | 42g (sensor only) |
| Power Consumption | Less than 1 watt |
| Temperature | Working temperature 0°C - 45°C. Storage Temperature -40°C - 70°C |
| Software Features: | |
| Internet Connection Type | Static IP / DHCP / PPPOE |
| DHCP: | Supported |
| Security Setup: | MAC-address filter, IP-address |
| Bandwidth Control: | filter, URL filter |
| Supported DDNS: | yndns, noip |
Quality, Capability and Cost
Too many times are we presented with three options and told to pick any two.
At Buzd we know that this is only acceptable due to the lack of real alternatives. Buzd Sensors provide all three, High Quality, Market Leading Capability and Attractive Cost. Why settle for only two decision criteria when you can have all three.
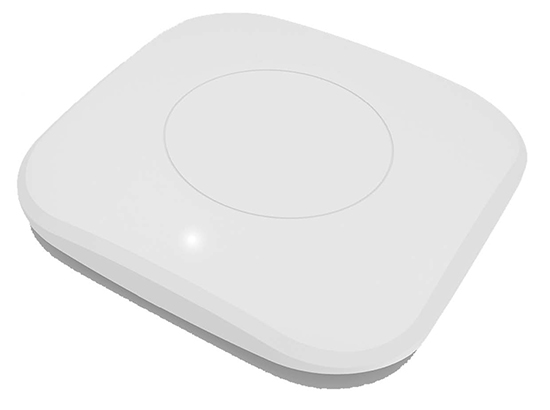
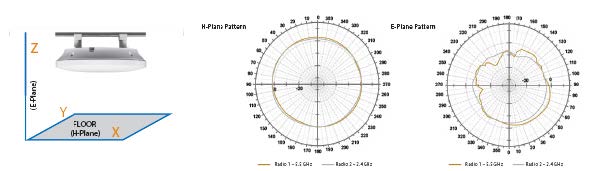
SensorOne:
Ceiling/Wall Mount Low Profile AP with integrated antennas
The Buzd SensorOne is IEEE 802.11a/b/g/n/ac standards-based, and operate on both 2.4 GHz b/g/n and 5 GHz a/n spectrums. Supporting the latest 802.11ac technology, including 80 MHz channels width, both access points achieve a 280% throughput improvement over their 802.11n equivalents.
The Buzd SensorOne is a next generation smoke detector form factor access point, perfect for discrete installations, such as hotel or school hallways. Supporting 2x2 MIMO technology with two spatial streams, this access point provides association rates of up to 867 Mbps.
The Buzd SensorOne has been designed specifically with real-time analytics in mind. The firmware and arial design has been optimized to provide the most highly accurate dedicated analytics sensor on the market. Designed and built by Buzd, the SensorOne may be deployed in sensor only mode, and through a small software upgrade may be upgraded at a later date to perform as both a sensor and highly secure Wi-Fi Access Point.
Deploying the Sensor One in sensor only mode reduces the cost of Implementation and where customers have already deployed a Wi-Fi solution keeps the cost to a minimum while ensuring the best analytics sensor designed specifically for Presence Analytics.
- 2.4GHz, IEEE 802.11 b/g/n
- 2.4GHz, Data Rate: up to 300Mbps for 40MHz channels;
- 5GHz, IEEE 802.11 a/n/ac
- 5GHz, Data Rate: up to 867Mbps in 802.11ac 80MHz channels
- 5GHz, Data Rate: up to 300Mbps for 40 MHz channels
- Operation Modes: Access Point
- Security with 802.1X, WPA, and AES
- Dual IEEE 802.3at (PoE)
| Specifications | |
|---|---|
| Hardware Specifications | |
| Base Platform | QCA 9557+QCA 9881+QCA8337 |
| CPU Clock Speed | 720 MHz |
| Wireless Radio | 802.11bgn/ac |
| Reset Switch Built-in | Push-button momentary contact switch |
| Standards Conformance | IEEE 802.3 / IEEE 802.3u |
| Ethernet Configuration | 10/100/1000 BASE-TX auto-negotiation Ethernet port x 2(RJ-45 connector) Auto MDI/MDI-X enabled, IEEE802.3af/at Power Over Ethernet Compatible |
| SDRAM | On board : 64 Mbytes |
| Flash | On board : 8 Mbytes |
| Built-In LED Indicators | 1x Power, 2x LAN |
| Wireless Specifications | |
| Network Standards Conformance | IEEE802.11 b /g /n compliant IEEE802.11b 1 / 2 / 5.5 / 11Mbps (auto sensing) IEEE802.11g 6 / 9 / 12 / 18 / 24 / 36 / 48 / 54(auto sensing) IEEE802.11n: 300Mbps (at 40MHz), 150Mbps (at 20MHz) IEEE802.11ac :867Mbps(at 80MHz) |
| Data Transfer Rate | |
| Channel Space | B/G Mode: 20MHz N Mode : 20/40MHz AC Mode : 80MHz |
| Frequency Range | IEEE802.11b/g 2.412 ~ 2.462GHz (USA) 2.412 ~ 2.484GHz (Japan) 2.412 ~ 2.472 GHz (Europe ETSI) 2.457 ~ 2.462 GHz (Spain) 2.457 ~ 2.472 GHz (France) IEEE802.11 a/n/ac: 5.150 – 5.350 & 5.725 – 5.825 GHz (USA) 4.900 – 5.250 GHz(Japan) 5.150 – 5.350 & 5.470 – 5.725GHz (Europe ETSI) |
| Media Access Protocol | CSMA / CA with ACK |
| Modulation Method | IEEE802.11b DSSS (DBPK, DQPSK, CCK) IEEE802.11g OFDM (64-QAM,16-QAM, QPSK, BPSK) IEEE802.11n : BPSK,QPSK,QPSK,16-QAM,64-QAM |
| Operating Channels | 802.11b/g/n: 11 for FCC,14 for Japan,13 for Europe, IEEE 802.11a/n/ac: 12 For FCC , 4 for Japan 4, 18 for Europe |
| RF Output Max. Power | 2.4GHz: 800mW 5GHz : 500mW |
| Frequency Response flatness | ±2dB over operating range |
| Receiver Sensitivity | -92 dBm |
| Operating Temperature | 0 °C ~ 50 °C |
| Storage Temperature | -20 °C ~ 60 °C |
| Operating Humidity | 10% to 80% Non-Condensing |
| Storage Humidity | 5% to 90% Non-Condensing |
| Antenna | Built-In |
| Power Supply | 110 – 220V AC Power; 12 VDC, Support 802.3af /at Compliant , Power Over Ethernet |
| Unit Dimensions | TBD (mm) (Width x Depth x Height) |
| Unit Weight | TBD |
| Form Factor | Ceiling/ Wall Mountable |
| Certifications | TBD |
Documentation:
Download the BuzD MiniSensor Datasheet (PDF).
Download the BuzD - Presence (PDF).
Download the BuzD - SensorOne (PDF).